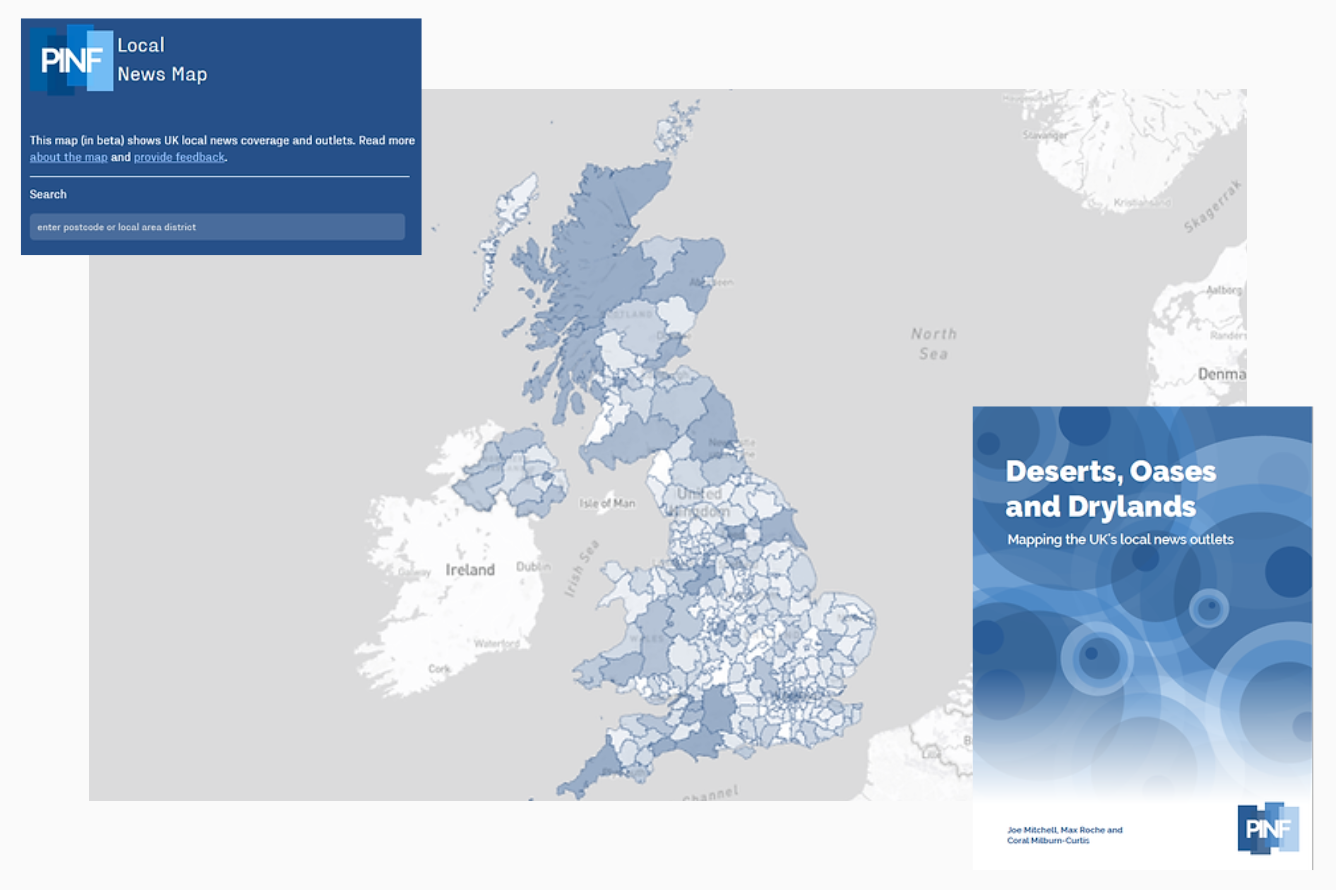
Local News Map

A living product to understand local media in the UK
Reports

UK Local News Report – December 2025
Our third report on local news outlets per local authority district, closures and launches since 2024, and the links with deprivation and demographics.
Local News Map Report – April 2024
Our second report on local media provision, investigating the best and worst covered districts in the UK.

Deserts, Drylands, and Oases – March 2023
Our first report on local media provision, investigating the best and worst covered districts in the UK.
About the project
PINF’s vision is for everyone to benefit from public interest news that speaks to them, for them and with them.
We wanted to find out how well (or poorly) every community in the UK is currently provided with news, so that we can encourage philanthropists and policymakers to target their resources on the local areas of greatest need.
The Local News Map project has three components. First, a database of local news outlets: titles, websites, owners, claimed coverage area(s), registered addresses and so on. Second, an interactive map brings that database to life, displaying local coverage information for each Local Authority District in the UK. Third, a series of reports created upon each iteration of the database to provide a snapshot analysis of the state of local media provision in the UK.
Any map is an imperfect, approximate version of reality. Ours is no different: we did not have the capacity to map every single route by which public interest news is conveyed in a local area.
To make the project manageable, we applied a criteria to define local news outlets, which you can see in the Definitions section of the latest report.
Click on each component below to learn more.
Interactive Map
The map is updated to late 2025. Your first view of the map is of the UK and the boundaries of local authority districts. The districts are coloured according to the number of local news outlets that claim to cover them. The darker the blue, the more news outlets there are in that district.
You can filter the overall view by the type of media and/or whether the outlet is independently- or corporate-owned.
The map highlights areas that are news deserts or at risk of becoming news deserts. Those districts that appear white on the map have no dedicated outlet that covers solely that district (even if they are covered by a regional outlet).
When you select a district, you can see the locations of the newsrooms of the outlets that cover that district (or the registered legal address where we could not find a newsroom address). A list of ‘cards’ on the left-hand side will also show you the outlets in that district, with more information and links to their websites. Independent outlets are in blue, corporate outlets in orange.
Where a newsroom is not located in the area that it serves, you will see a dotted line to the location of the newsroom (or the registered address). You’ll notice – via those dotted lines – that many newsrooms are not located within the area that they serve.
When you select an outlet, you will either see another dotted line to the location of its registered office address, or, if it is registered in the local authority district it serves, a note saying that it is owned locally.
Reports
Having now created a substantial database of local news providers and outlets across the UK, we can map changes over time and run analysis. We have now published multiple reports since 2023 on news deserts, drylands and oases. We have also run analysis of correlations between the number of news outlets in a local authority district and, for example, that district’s deprivation ranking, or demographics.
If you’d like to do your own analysis or you have hypotheses about the correlations between local news outlets and other characteristics of local areas, such as health or environmental data, please do get in touch.
FAQ
Which outlets are mapped?
Due to limited capacity, the first database we created only included local news outlets that are/were legally incorporated (i.e. a registered company, charity or society). For more recent database updates, we made exceptions and included established news outlets even where unincorporated, where we have been notified of their existence and where we have been able to verify this.
The data does not include Facebook/NextDoor/WhatsApp groups, blogs, hyperlocal newsletters, and so on - something we would be keen to research further, if funding allowed.
What counts as local?
The map only includes ‘local’ outlets, which we define as outlets covering an area that makes up fewer than five local authority districts. With greater capacity, we would be interested to develop a regional news mapping of those outlets that cover five or more districts.
Would PINF consider changing our methodology?
We are constantly seeking additional funding to build on the map, which would allow us to continue to update the methodology, the data-checking tools, and the visualisation, for an ever more accurate and detailed picture. However, no map will ever perfectly reflect the constantly changing variety of news outlets.
Could this data be crowdsourced?
We continue to review the best ways to collect the most comprehensive and accurate data possible. Many hands can make light work, but the up-front cost to build a crowdsourcing platform and the ongoing costs to maintain and solve disputes is not currently available to us.
Can I submit a correction or a suggestion?
Please do, using this form. We may not be able to act on this information without new funding for the mapping project.
